Permanent Portfolio®
-
OVERVIEW
Objective
Permanent Portfolio seeks to preserve and increase the purchasing power value of its shares over the long term.Strategy
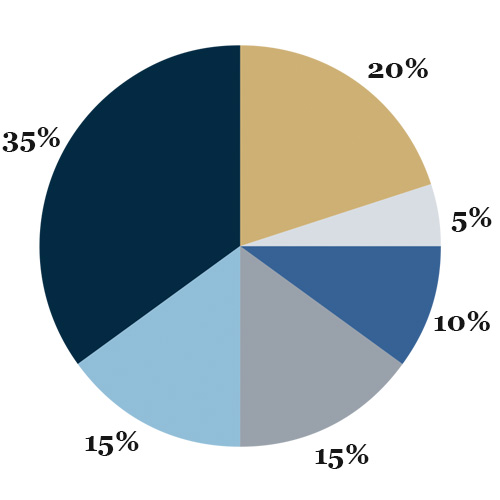
A Fund for All Seasons® Designed as a core portfolio holding, Permanent Portfolio seeks to preserve and increase the purchasing power value of each shareholder’s account over the long-term, regardless of current or future market conditions, through strategic investments in a broad array of different asset classes.In pursuit of its investment objective, Permanent Portfolio invests a fixed “Target Percentage” of its net assets in each of the following investment categories:

Target Portfolio Structure:
- Gold
- Silver
- Swiss Franc Assets
- Real Estate and Natural Resource Stocks
- Aggressive Growth Stocks
- Dollar Assets
Reasons to Consider
- 1 Seeks long-term performance regardless of economic environment.
- 2 Non-leveraged and multi-asset class investment strategy at all times.
- 3 Complements global allocation or macro investment strategies with significant fixed income or equity weightings.
-
PERFORMANCE
Performance data quoted represents past performance and does not guarantee future results. The investment return and principal value of an investment will fluctuate so that an investor's shares, when redeemed, may be worth more or less than their original cost. Investment performance, current to the most recent month-end, may be lower or higher than the performance quoted. It can be obtained by calling (800) 531-5142. Performance data shown with load reflects the Class A shares maximum sales charge of 5.00% and the Class C shares maximum deferred sales charge of 1.00%. Performance data shown as no load does not reflect the current maximum sales charges. Had the sales charge been included, the fund's returns would be lower. All results are historical and assume the reinvestment of dividends and capital gains.
Historical Performance: Annual Returns Since Inception
Average Annual Total Returns (as of December 31, 2025)
YTD 1 Year 5 Years 10 Years 15 Years Inception Class I 28.78% 28.78% 12.52% 11.19% 7.27% 7.07% Class A (Load) 22.02% 22.02% 11.09% - - 9.95% Class A (No Load) 28.45% 28.45% 12.24% - - 10.54% Class C (Load) 26.49% 26.49% 11.40% - - 9.71% Class C (No Load) 27.49% 27.49% 11.40% - - 9.71% FTSE 3-Month U.S. Treasury Bill Index 4.40% 4.40% 3.31% 2.23% 1.50% 3.61% S&P 500 17.88% 17.88% 14.42% 14.82% 14.06% 12.05% Expense Ratios Class I Class A Class C Gross Expense Ratio .81% 1.06% 1.81%


